Introduction
Most traders know about RSI and MACD. But when you combine them strategically, they can become a highly reliable system for spotting accurate entry and exit points. For NSE traders, especially beginners and intermediates, this dual-indicator strategy can help cut through the noise and boost your trade timing.
Understanding the Basics
What is RSI?
RSI (Relative Strength Index) is a momentum oscillator that measures the speed and change of price movements.
- Ranges between 0 and 100
- Overbought zone: Above 70
- Oversold zone: Below 30
- Neutral: Around 50
What is MACD?
MACD (Moving Average Convergence Divergence) is a trend-following momentum indicator.
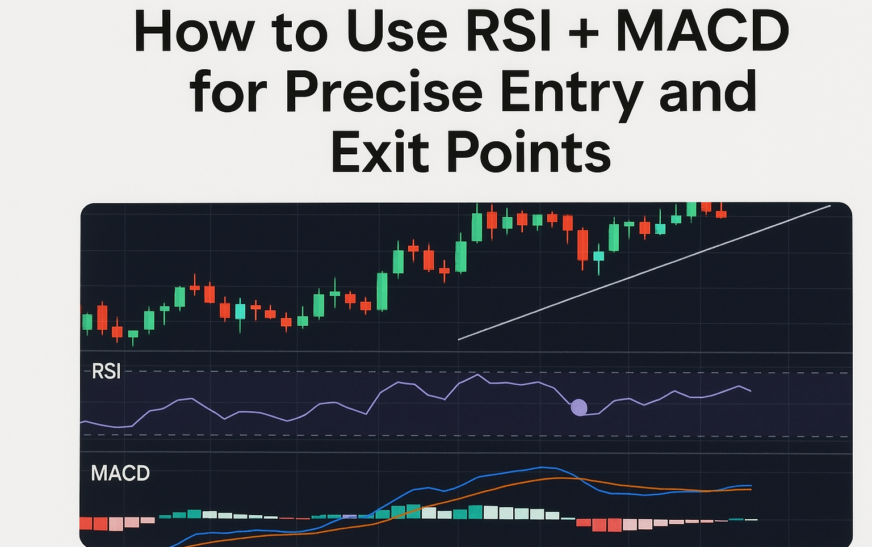
It shows the relationship between two EMAs (12-EMA and 26-EMA) and plots:
- MACD Line
- Signal Line
- Histogram (the difference between the MACD and Signal line)
Why Combine RSI and MACD?
- RSI tells you if a stock is overbought or oversold
- MACD tells you if momentum is shifting or continuing
- Together, they provide confirmation of both strength and timing
Step-by-Step: Trading with RSI + MACD
1. Entry Signal (Buy)
Conditions to Watch For:
- RSI crosses above 30 (coming out of oversold)
- MACD Line crosses above Signal Line (bullish crossover)
This means: Momentum is shifting upward, and the stock is exiting a weak zone.
Bonus Tip: Entry is stronger if RSI is below 50 and MACD crossover happens after a price correction.
2. Exit Signal (Sell or Take Profit)
Conditions to Watch For:
- RSI crosses below 70 (coming down from overbought)
- MACD Line crosses below Signal Line (bearish crossover)
This means: The trend may be weakening—time to take profits or tighten your stop-loss.
Example: Bank Nifty Trade Setup
- RSI = 28 (oversold zone)
- RSI crosses above 30 with upward momentum
- MACD crossover happens on the next candle
- Buy entry is taken with a stop below recent low
- Exit when RSI reaches 65–70 and MACD shows loss of momentum
Best Timeframes to Use
| Style | Timeframe |
|---|---|
| Intraday | 5-min or 15-min |
| Swing Trading | 1-hour or Daily |
| Positional | Daily or Weekly |
Use higher timeframes for reliability and lower ones for quick trades—but always wait for both indicators to align.
Risk Management Tips
- Use strict stop-loss below recent swing low
- Don’t enter if only one indicator gives a signal
- Combine with trendlines or price action for confirmation
- Don’t force trades in sideways or news-driven markets
Common Mistakes to Avoid
- Entering just because RSI is below 30 or MACD crossed—wait for both to align
- Using RSI in trending markets without context—it may stay overbought/oversold for long
- Ignoring volume or price structure—use indicators as a guide, not the sole reason to trade
Conclusion
The combination of RSI + MACD provides a powerful, double-confirmation method for entry and exit signals. Whether you trade stocks, options, or indices on the NSE, this approach helps reduce false signals and improve precision. Like all strategies, it works best when combined with proper risk management, discipline, and backtesting.

